Jadice Flow Prometheus Metrics Documentation & Grafana Dashboards
This documentation provides information about all available Prometheus metrics endpoints for Jadice Flow and how to use them effectively in Grafana dashboards.
Note: Example setup (preset grafana dashboard) is provided by Jadice team and can be adapted to your needs.
Metric variations
Most of the metrics are provided by the controller, but there are also some available from the workers:
Controller metrics
- Audit Service Metrics - Internal service for writing and managing database metrics. Can be used to see database insert speed.
- Job Controller Metrics - Metrics related to job processing and management.
- Worker Service Pool Metrics - Metrics about the pool of worker services used by the controller to communicate with workers.
- Item Processing Metrics - Shows how long it takes for an item to be processed by a step.
- Item Writer Metrics - The time it takes to write item state into the database.
- JDBC Persister Metrics - Shows how long it takes to insert the job request into the database.
- Job Management Metrics - Job management metrics (job queues).
- Step Execution Metrics - Metrics related to the execution of steps within jobs.
- Worker Pool Management Metrics - Pool containing worker clients, are used by controller to send request to the workers. Can be used for scaling situations.
Worker metrics
Note: Worker metrics are proportional to the number of active workers. For now there are 3 types of the metrics, so if for example you have 5 active workers, you will see 15 metrics in total.
- Active Worker - Number of active workers in period of time.
- Work Started Total - Indicates when a worker starts processing a job. (Currently not available)
- Work Finished Total - Indicates when a worker finishes processing a job. (Currently not available)
Labels and their Usage
Labels are key-value pairs that provide additional context to metrics. They help in filtering and aggregating data for more granular insights. Common labels include:
Note: To help users with filtering and aggregating metrics, some of the labels are added to the variables above the dashboard.
job: Job namestep: Step name within a jobworker: Worker namejobName: Specific job namejobType: Type classification of the job
Labels can be used in Prometheus queries to filter metrics. For example, to get the count of specific jobs, you can use:
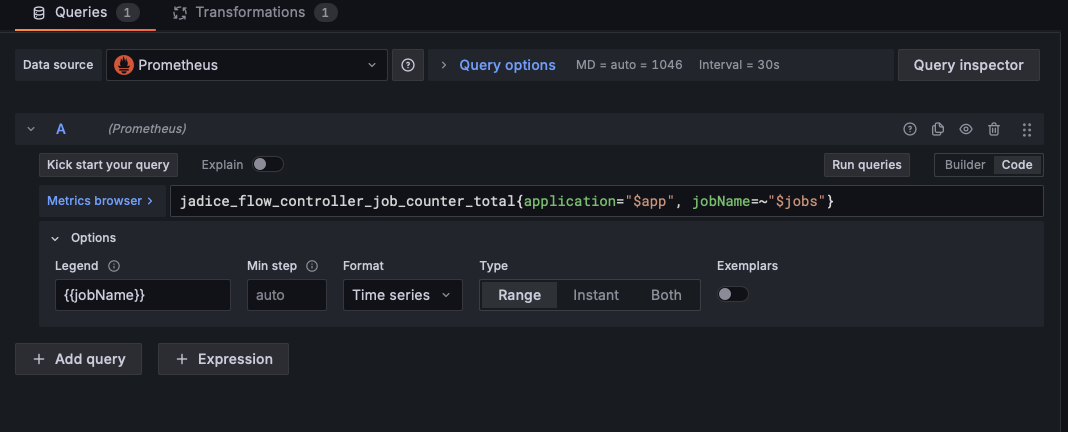
jadice_flow_controller_job_counter_total{application="$app", jobName=~"$jobs"}
In this example, $APP and $JOB are variables that can be set in Grafana to filter the metrics dynamically. Or you can specify a specific job name directly in the query:
jadice_flow_controller_job_counter_total{application="MyApp", jobName="MyJob"}
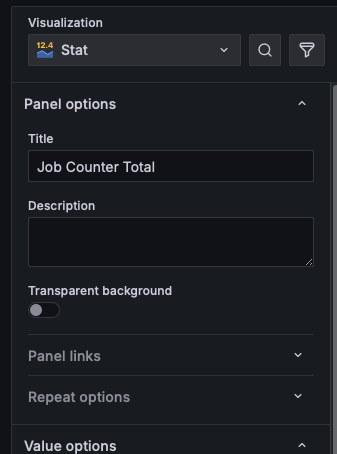
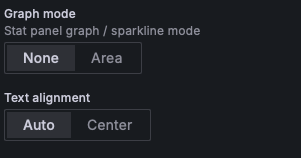
You can also use Stat visualization and set the Graph mode to None to get a quick overview of the metric value:
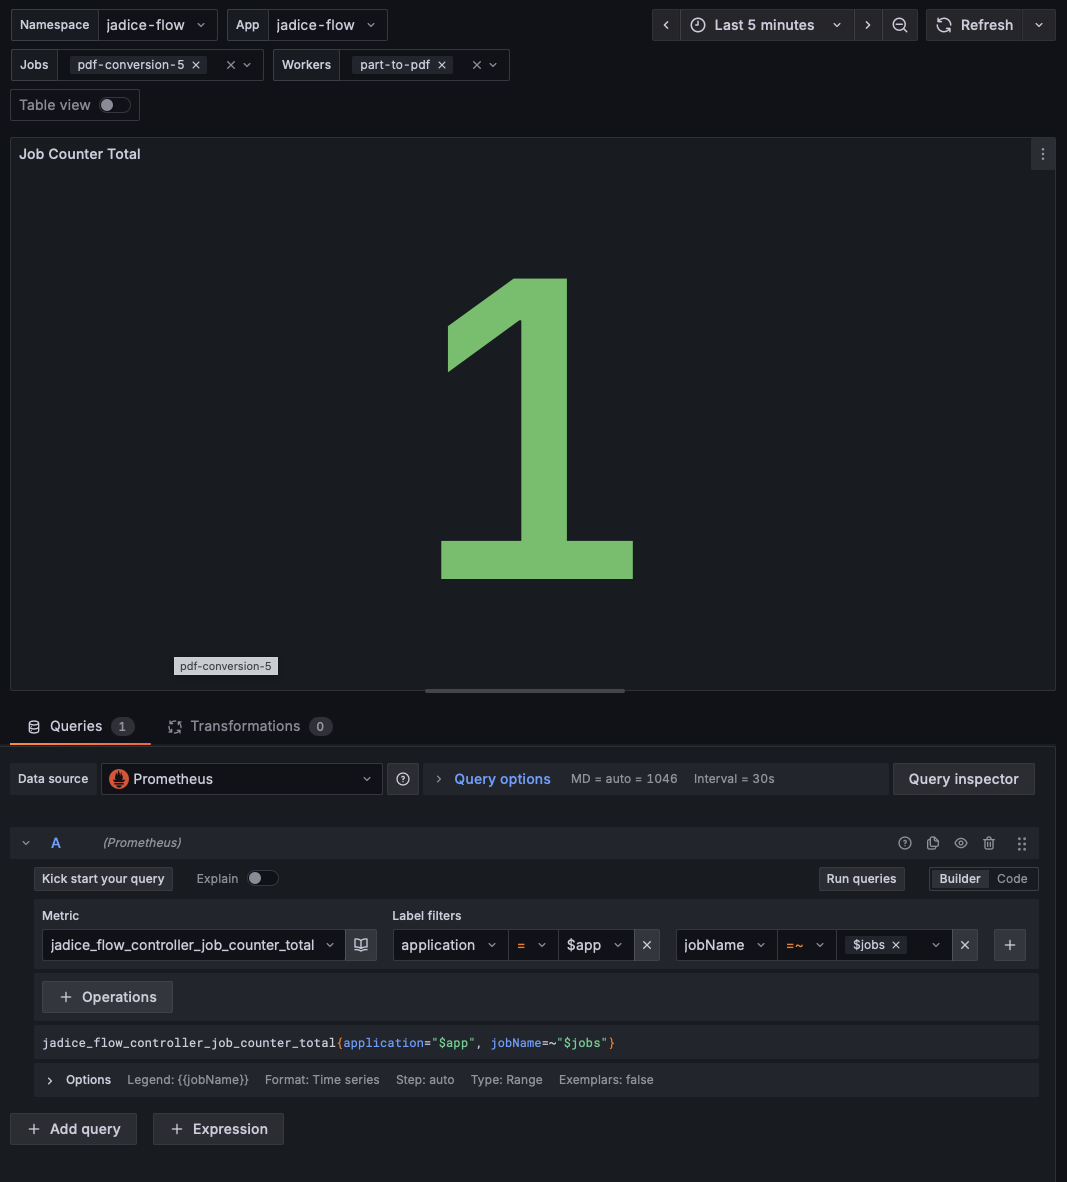
At the end you will have a visualization similar to this (depending on your setup):
Metric Types
Currently these are the Jadice Flow metrics available from the controller and workers.
Audit Service Metrics
jadice_flow_auditService_queue
- Type: Gauge
- Aggregation: Average
- Description: Size of the auditService queue (should usually be a low value, an increasing value could indicate JDBC performance problems).
jadice_flow_auditService_readCount_total
- Type: Counter
- Aggregation: Sum
- Description: Read count of the audit service when reading audit infos from database for an item.
jadice_flow_auditService_writeCount_total
- Type: Counter
- Aggregation: Sum
- Description: Write count of the audit service when writing audit infos to database for an item.
Job Controller Metrics
jadice_flow_controller_job_counter_total
- Type: Counter
- Aggregation: Sum
- Description: Total number of jobs processed by the controller.
jadice_flow_controller_job_timer_seconds_count
- Type: Counter
- Aggregation: Sum
- Description: Number of job timing measurements recorded.
jadice_flow_controller_job_timer_seconds_max
- Type: Gauge
- Aggregation: Average
- Description: Maximum job execution time recorded in seconds.
jadice_flow_controller_job_timer_seconds_sum
- Type: Counter
- Aggregation: Sum
- Description: Total time spent executing jobs in seconds.
Worker Service Pool Metrics
jadice_flow_controller_workerServicePool_active
- Type: Gauge
- Aggregation: Average
- Description: Number of currently active workers in the service pool.
jadice_flow_controller_workerServicePool_wait
- Type: Gauge
- Aggregation: Average
- Description: Shows parallel jobs.
Item Processing Metrics
jadice_flow_itemProcessor_item_error_total
- Type: Counter
- Aggregation: Sum
- Description: Total number of item processing errors.
jadice_flow_itemProcessor_item_processed_total
- Type: Counter
- Aggregation: Sum
- Description: Total number of items successfully processed.
jadice_flow_itemProcessor_part_added_total
- Type: Counter
- Aggregation: Sum
- Description: Total number of parts added during item processing.
Item Writer Metrics
jadice_flow_itemWriter_writeTime_seconds_count
- Type: Counter
- Aggregation: Sum
jadice_flow_itemWriter_writeTime_seconds_max
- Type: Gauge
- Aggregation: Average
jadice_flow_itemWriter_writeTime_seconds_sum
- Type: Counter
- Aggregation: Sum
JDBC Persister Metrics
jadice_flow_jdbcPersister_insertTimeMS_seconds_count
- Type: Counter
- Aggregation: Sum
- Description: Shows the sum of time in which the jdbc persister was persisting jobs.
jadice_flow_jdbcPersister_insertTimeMS_seconds_max
- Type: Gauge
- Aggregation: Average
- Description: Shows the sum of time in which the jdbc persister was persisting jobs.
jadice_flow_jdbcPersister_insertTimeMS_seconds_sum
- Type: Counter
- Aggregation: Sum
- Description: Shows the sum of time in which the jdbc persister was persisting jobs
Job Management Metrics
jadice_flow_jobDeletion_queue
- Type: Gauge
- Aggregation: Average
- Description: Number of jobs queued for deletion.
jadice_flow_jobLauncher_persistTimeMS_seconds_count
- Type: Counter
- Aggregation: Sum
jadice_flow_jobLauncher_persistTimeMS_seconds_max
- Type: Gauge
- Aggregation: Average
jadice_flow_jobLauncher_persistTimeMS_seconds_sum
- Type: Counter
- Aggregation: Sum
jadice_flow_jobLauncher_queuedJobs
- Type: Gauge
- Aggregation: Average
- Description: Number of jobs currently queued for execution.
jadice_flow_jobLauncher_queuedJobsByType
- Type: Gauge
- Aggregation: Average
- Description: Number of queued jobs grouped by job type.
jadice_flow_jobLauncher_runningJobs
- Type: Gauge
- Aggregation: Average
- Description: Number of jobs currently executing.
Step Execution Metrics
jadice_flow_step_counter_total
- Type: Counter
- Aggregation: Sum
- Description: Total number of steps executed.
jadice_flow_step_timer_seconds_count
- Type: Counter
- Aggregation: Sum
- Description: Number of step timing, full step with all items.
jadice_flow_step_timer_seconds_max
- Type: Gauge
- Aggregation: Average
- Description: Maximum step execution time in seconds.
jadice_flow_step_timer_seconds_sum
- Type: Counter
- Aggregation: Sum
- Description: Total time spent executing steps in seconds.
Worker Pool Management Metrics
jadice_flow_workerServicePool_borrow_total
- Type: Counter
- Aggregation: Sum
jadice_flow_workerServicePool_release_total
- Type: Counter
- Aggregation: Sum
jadice_flow_workerServicePool_waitTimeToBorrow_seconds_count
- Type: Counter
- Aggregation: Sum
jadice_flow_workerServicePool_waitTimeToBorrow_seconds_max
- Type: Gauge
- Aggregation: Average
jadice_flow_workerServicePool_waitTimeToBorrow_seconds_sum
- Type: Counter
- Aggregation: Sum
Metrics from Workers
Note: Only available if prometheus for the workers is set up separately from the controller metrics installation (Are not enabled by default with the controller metrics).
workerActive_jf_worker_{WorkerName}
- Type: Gauge
- Aggregation: Average
- Description: Indicates if the worker is active.
workStarted_jf_worker_{WorkerName}_total
- Type: Counter
- Aggregation: Sum
workFinished_jf_worker_{WorkerName}_total
- Type: Counter
- Aggregation: Sum
Monitoring Best Practices
- Performance Monitoring: Use timer metrics (sum/count) to calculate average execution times.
- Error Tracking: Monitor error counters to identify failure patterns.
- Capacity Planning: Track queue depths and active workers for resource planning.
- Trend Analysis: Use rate() and increase() functions for analyzing metric trends over time.